Launch Monitor Data – 33 Parameters Explained
Posted in Launch Monitor Data, Launch Monitors
Launch monitor data splits into two families: ball data (speed, launch, spin — what the ball did) and club data (speed, path, face — what you did to it). The 33 parameters below explain every number your screen shows. New for this refresh: whether your device measures or models each one — because that, more than any spec-sheet count, decides which numbers deserve your trust. 👉 Quick Verdict below, then the trust table, then the full reference.
In a Nutshell
Launch monitor data splits into ball data (speed, launch, spin: what the ball did) and club data (speed, path, face: what you did to it), and the 33 parameters below explain every number on your screen. Trust the ball data, hold club data loosely unless your device measures it directly, and remember that carry distance is always a model output.
👉 Trust the ball data; hold the club data loosely unless your device measures it directly — and know that “displayed” never means “measured.”
Three working rules:
- Ball data is the reliable core on any credible unit — stated independently by multiple owners across separate threads and devices.
- Club data varies by device: some measure it directly (the Full Swing KIT’s radar tracks the clubhead itself; camera units read stickers or markers), SkyTrak calculates it from ball flight, and several devices gate it behind add-ons or subscription tiers. One data-focused owner put the buying question well: it isn’t “does it show club path,” it’s does it measure it, and what do you have to buy to turn it on.
- Patterns over sessions beat any single reading — a principle owners keep rebuilding tools to enforce, from CSV exports to per-club “stock shot” profiles.
Jargon, once: measured = a sensor captured it directly; calculated/modeled = software derived it from other numbers. Photometric = high-speed-camera tracking; radar = Doppler microwave tracking. Smash factor = ball speed ÷ club speed. Spin axis = the tilt of the ball’s spin, which sets curve. Gear effect = off-center strikes twisting the ball’s spin against the club path. GSPro = the community’s favorite third-party sim software. RCT balls = Titleist’s radar-friendly balls some units read best.

How this has changed
- The trust question replaced the glossary question. Owner threads now argue about which numbers are real before they argue about what the numbers mean.
- SkyTrak’s club data is confirmed calculated, not measured: “Attack angle (angle of attack) is not directly measured by the SkyTrak ST MAX or SkyTrak+ despite being listed in some spec sheets.” SkyTrak has never published an itemized measured-vs-calculated table — an open conflict this article ships acknowledged.
- Even Trackman draws calibration skepticism now, and its own display carries a tell most users don’t know about — covered in the diagnostics section.
- New devices earn community verification fast: the Square Omni went from contested pre-release buzz to owned-and-endorsed within the summer, while a rival’s stickerless club-data promise was reported walked back before shipping.
Ball data vs club data — the map
Every parameter below belongs to one of two families. Ball data describes the ball’s flight: speed, launch angles, spin, and everything derived from them. Club data describes the delivery: club speed, path, face angle, loft, strike location.

The third axis matters most: measured versus modeled. Photometric units use high-speed cameras — thousands of frames per second — around the hitting zone to image the ball (and, with stickers or markers, the club) at impact. Doppler radar units track the moving ball and clubhead through an electromagnetic field, ballistics-style. Both then hand off to software.

And here is the thesis in miniature: carry distance is always a model output. No indoor unit watches a ball land 280 yards away; carry is computed from ball speed, launch and spin. Good inputs make the model good — but a carry number is only ever as honest as what fed it. The site’s reality-gap guide covers what that means on course: Golf Simulator Vs Reality – 14 Tips to Improve Realism in your Golf Simulator.
The trust table
Per-device, from the manuals and official documentation on record — blank-honest where nothing is documented:
| Device | Ball data | Club data | Ball requirements |
|---|---|---|---|
| SkyTrak+ / ST MAX | Measured: speed, launch angle, side angle, back spin, side spin (camera). Calculated: carry + 7 more (run, total, apex, offline, descent, flight time, 3D render) | Marketing lists club speed, smash, path, face angle as captured — but attack angle is confirmed not directly measured despite spec sheets; club figures are derived from ball flight. Open conflict, unresolved by SkyTrak | Clean white ball on the laser dot; logo facing the lens for best spin |
| Uneekor EYE XO | Measured: the widest documented set — speed, spin, spin axis, launch, descent, apex, flight time, run, carry, total | Measured with bar+dot stickers: club speed, smash, path, face-to-path, attack angle, face angle, dynamic loft, lie, impact point | Any ball; stickers recommended for club data (400 included) |
| Foresight GCQuad / QuadMAX | Measured: launch, side angle, speed, total spin, spin axis, carry (QuadMAX adds apex, descent, offline) | Measured via quadrascopic 4-camera capture with club markers: speed, smash, path, attack angle, loft/lie, face angle, impact location, closure rate (1 marker = basics; 4 markers = full face data) | Any ball — nothing on the ball, markers on the club |
| Full Swing KIT | Measured by radar: speed, launch, horizontal angle, spin rate, spin axis — though reviewers and four separate owners call spin its least consistent metric, an issue Full Swing has acknowledged. Calculated: carry, total, apex, side distances | Measured by radar off the clubhead: club speed, attack angle, path, face angle, face-to-path | Any ball; Titleist RCT balls enhance spin detection (not required) |
One honest wrinkle deserves its own line: the SkyTrak row is a live contradiction — its marketing lists measured club data while the documented record says calculated — and this article ships both sides rather than picking one quietly.
Ball flight data

Ball Speed
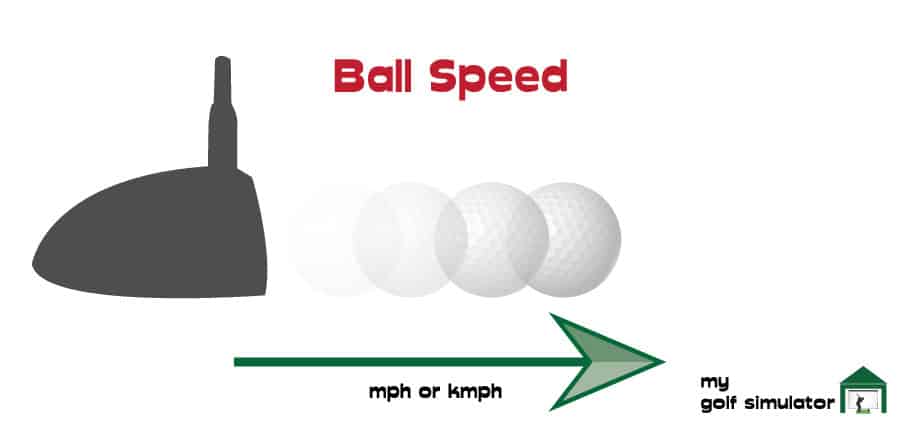
The ball’s speed leaving the clubface, the single biggest input to distance. Driven by club speed and strike efficiency. Measured directly by every credible unit — the most trustworthy number on your screen.
Vertical Launch Angle
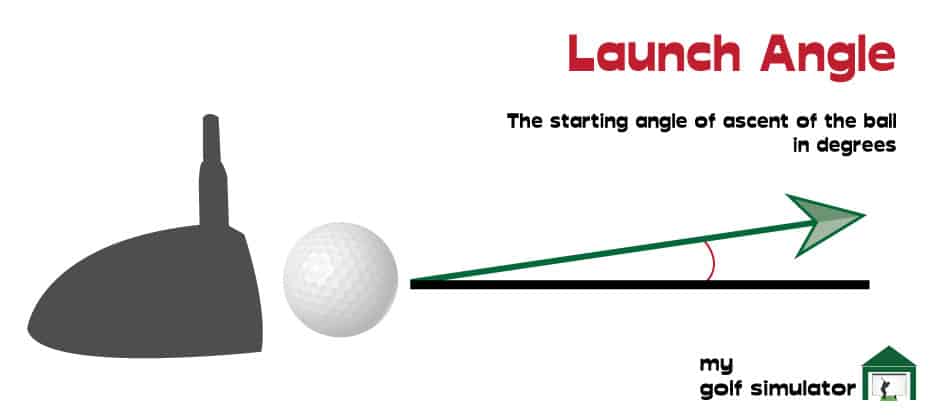
The ball’s takeoff angle relative to the ground. Too low wastes carry; too high balloons the shot into spin and drop. Always reads slightly below dynamic loft — controlling it is how better players hit chosen distances.
Side Angle
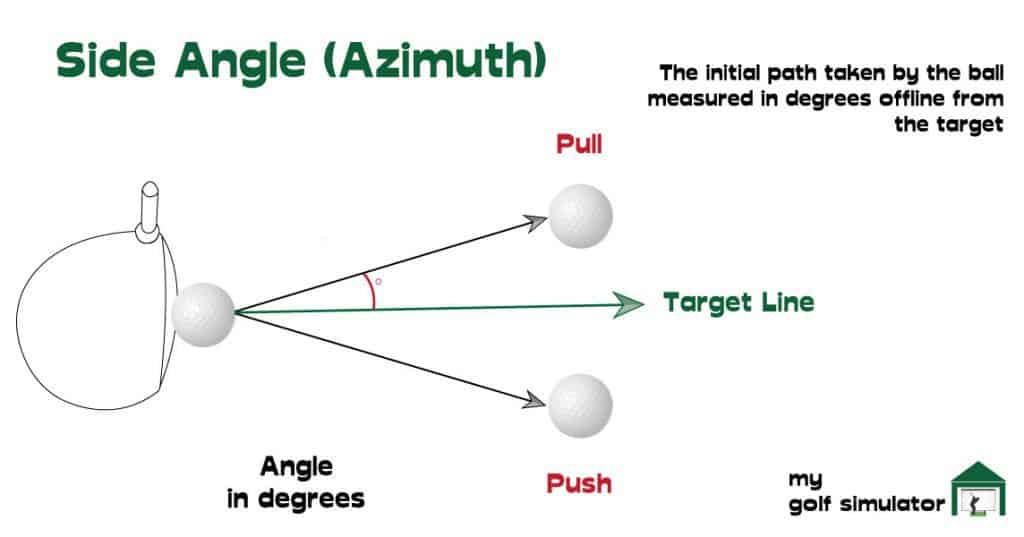
Also called horizontal launch angle or azimuth: the direction the ball starts relative to the target line. Tracks the face angle closely, but not exactly.
Back Spin
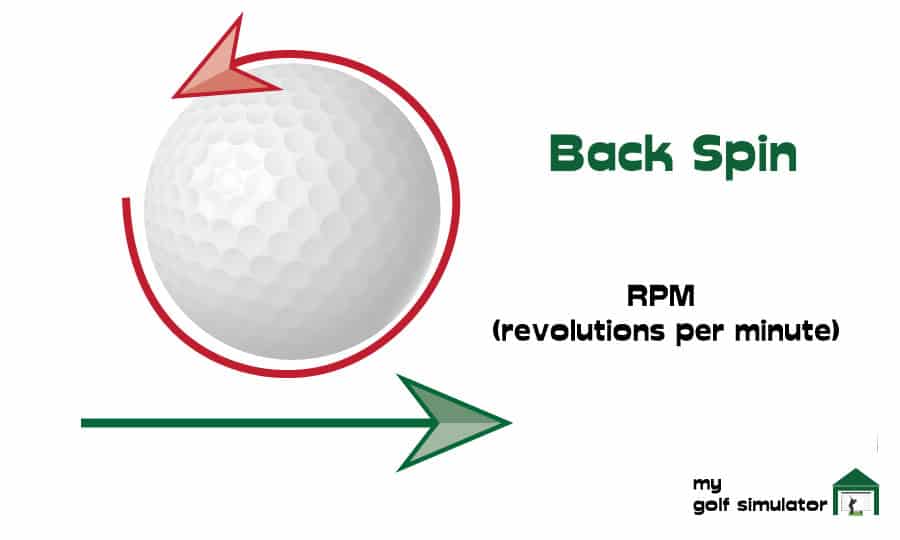
Front-to-back spin speed as the ball leaves the face. The long-standing rules of thumb hold: ~2,500rpm driver, ~10,000rpm sand wedge. Master it and distance and height control follow.
Side Spin
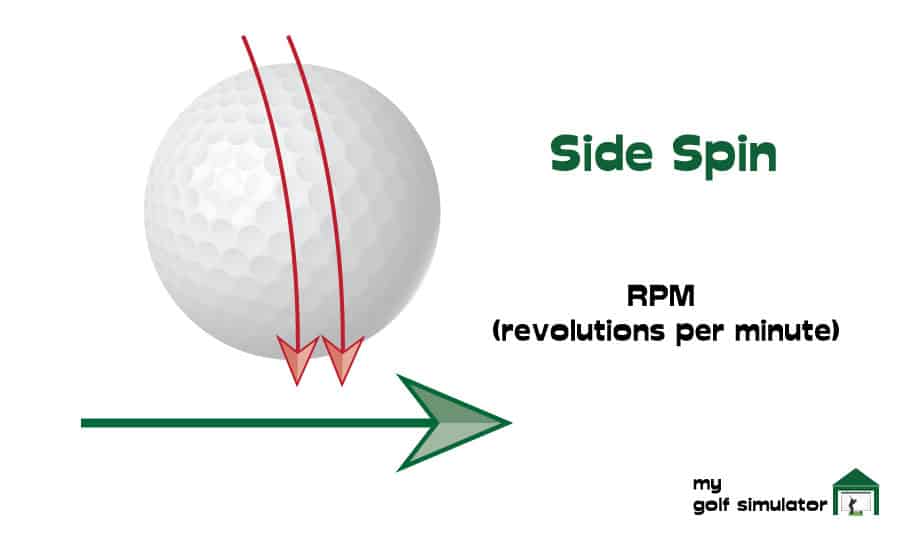
The horizontal spin component that curves a shot into a draw or fade. In truth the ball spins on one tilted axis — so better readouts show total spin (the full rate around that axis) plus spin axis instead.
Spin Axis
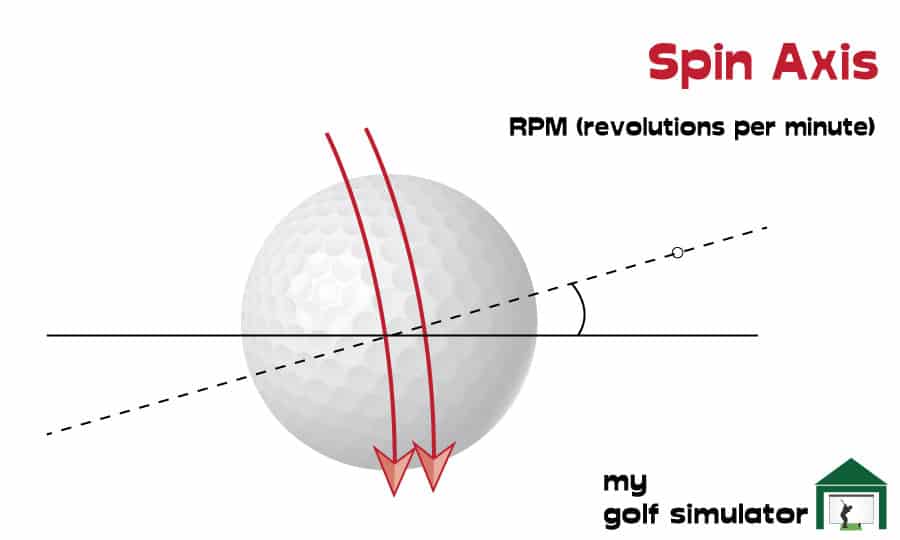
The tilt of the ball’s spin axis: negative for left curve, positive for right. Between −2 and +2 flies essentially straight (rule of thumb). Trackman measures it outdoors; most systems model it from face-to-path and spin loft.
Carry Distance
How far the ball flies before landing. Modeled on every indoor unit, computed from speed, launch and spin — see the map above.
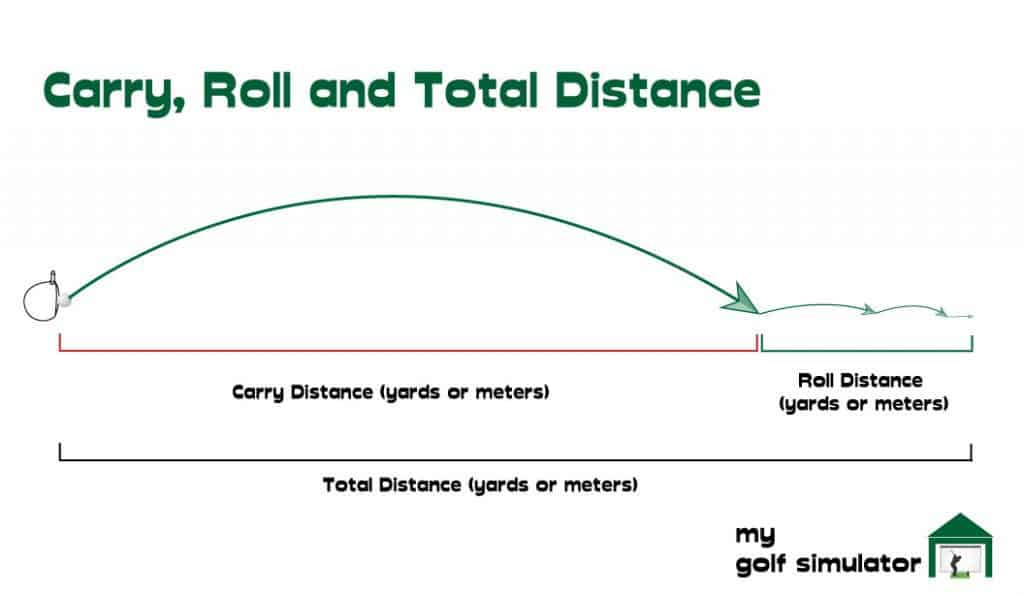
Roll Distance
Modeled ground travel after landing, bounce included.
Total Distance
Carry plus roll; where the ball rests.
Apex Height
The peak height of the flight path. Useful for practicing windows: low stingers, high soft-landers.
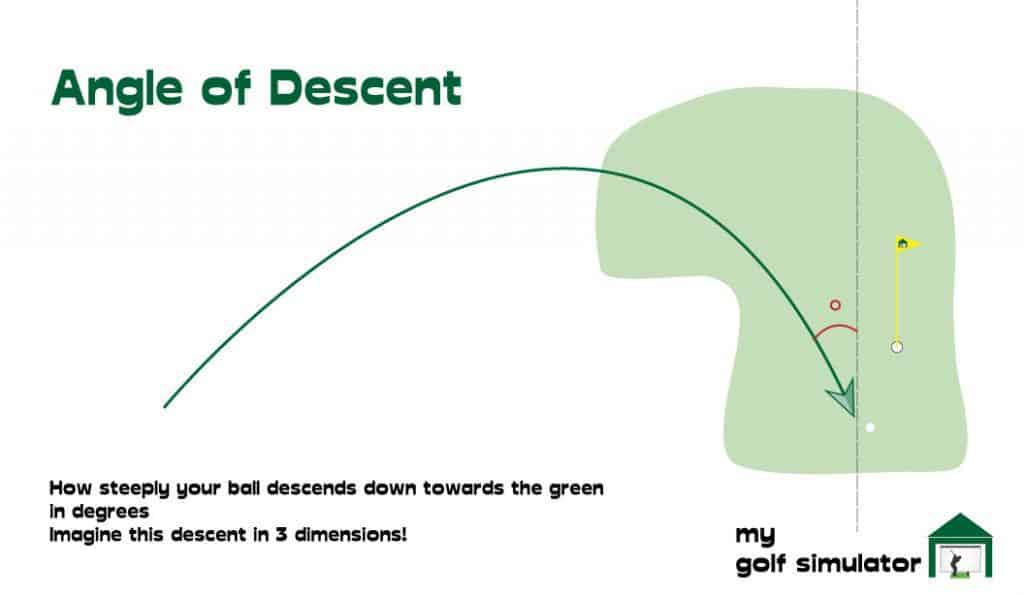
Angle of Descent
How steeply the ball lands. High = drop-and-stop; low = release and run.
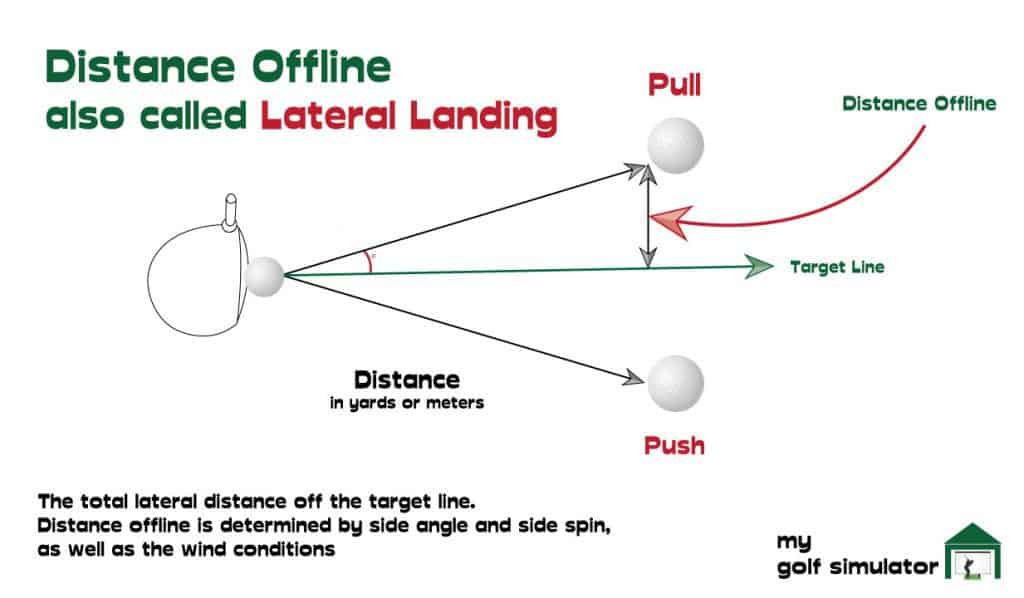
Lateral Landing
How far from the target line the ball lands (also called distance offline).
Curve
Sideways movement relative to the launch direction, in yards/meters with an L or R — shape without the starting line.
Flight Time
Seconds airborne, driven by speed, launch and spin. Also called hang time.
Club data



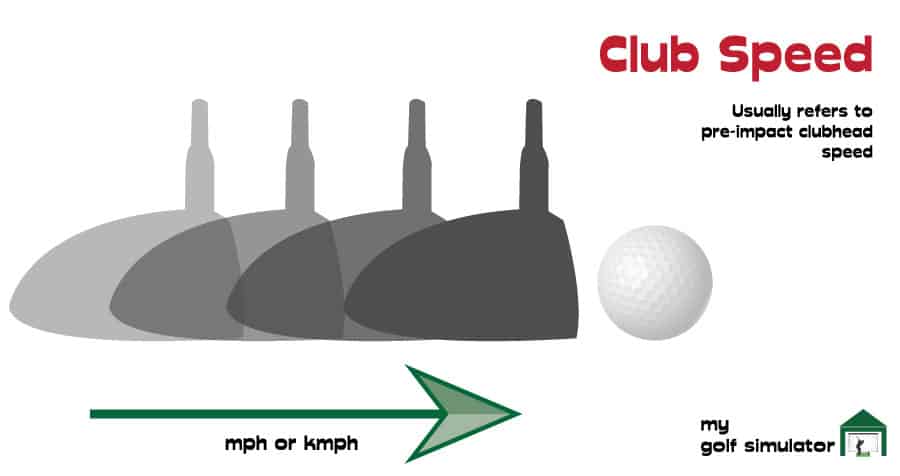
Clubhead Speed
The club’s speed just before impact. Raw potential — but strike quality decides how much becomes ball speed: a fast swing with an open face or heel strike wastes its own speed.
Smash Factor
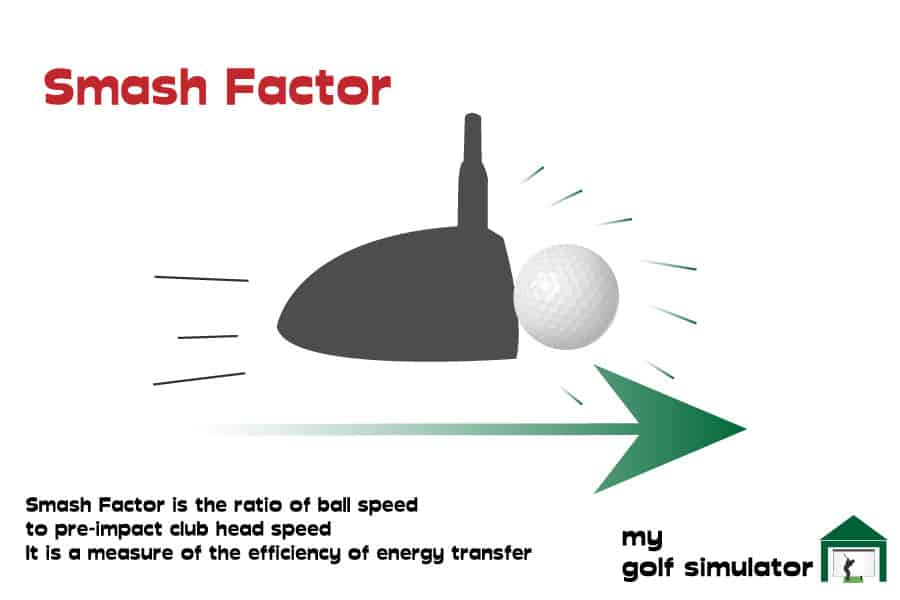
Ball speed ÷ club speed: energy-transfer efficiency. Targets: ~1.5 driver, ~1.24 pitching wedge (lofted clubs run lower by design). If club speed reads higher than ball speed, distrust the data, not your swing.

Club Speed Profile
How club speed transitions through impact; a fitter’s metric. Pros trend linear — a stability tell.
Acceleration Profile
The club’s acceleration through the strike, in g-force. Flat suggests a stable delivery.
Angle of Attack
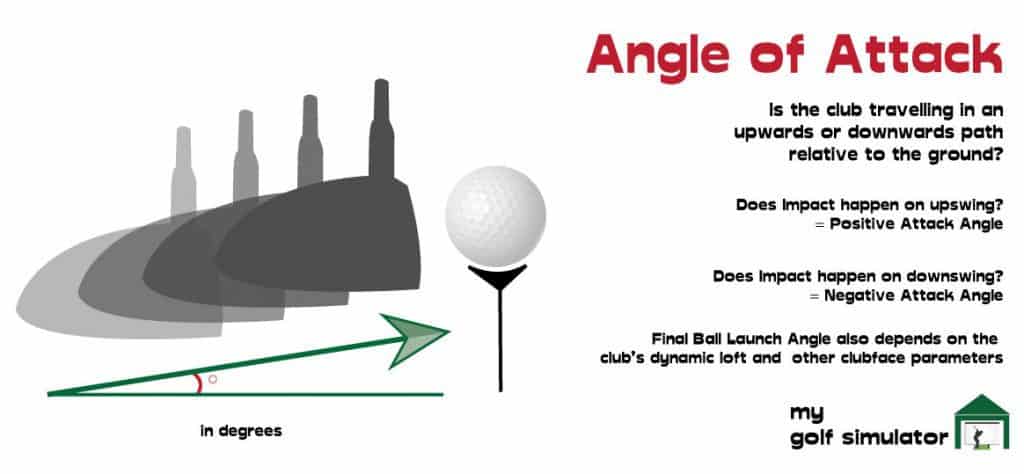
Up or down strike direction: positive teed drivers, negative irons. Measured by GCQuad, KIT and EYE XO; calculated by SkyTrak. (One detailed R10 owner rates its AoA merely “decent” — an owner’s breakdown, not manual-confirmed; more on that tier in the money section.)
Club Path
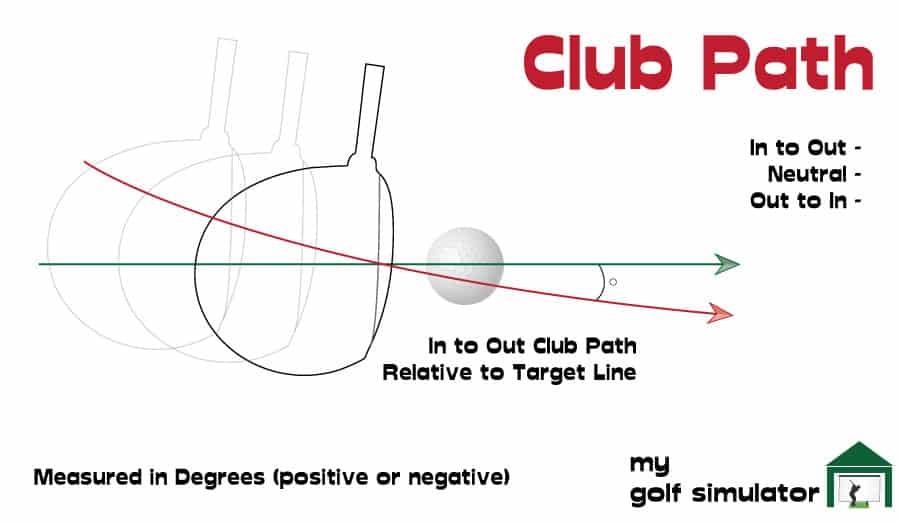
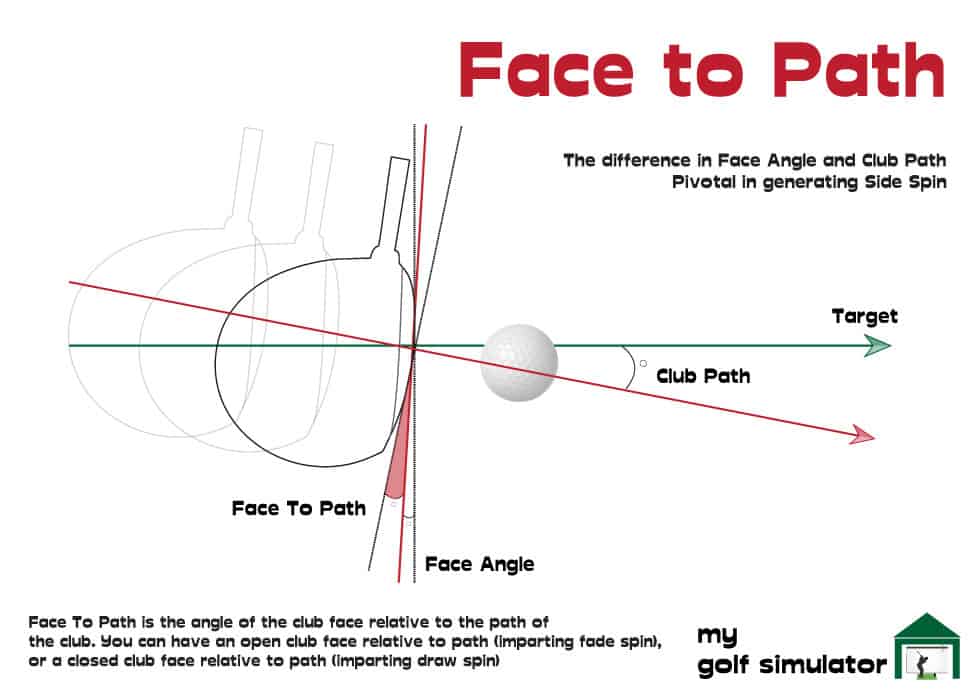
The clubhead’s direction at impact relative to the target line: in-to-out positive (draw territory for a right-hander), out-to-in negative (fade). On the GCQuad family, path capture comes with closure rate — how fast the face rotates through impact, its distinctive extra metric.
Face Angle
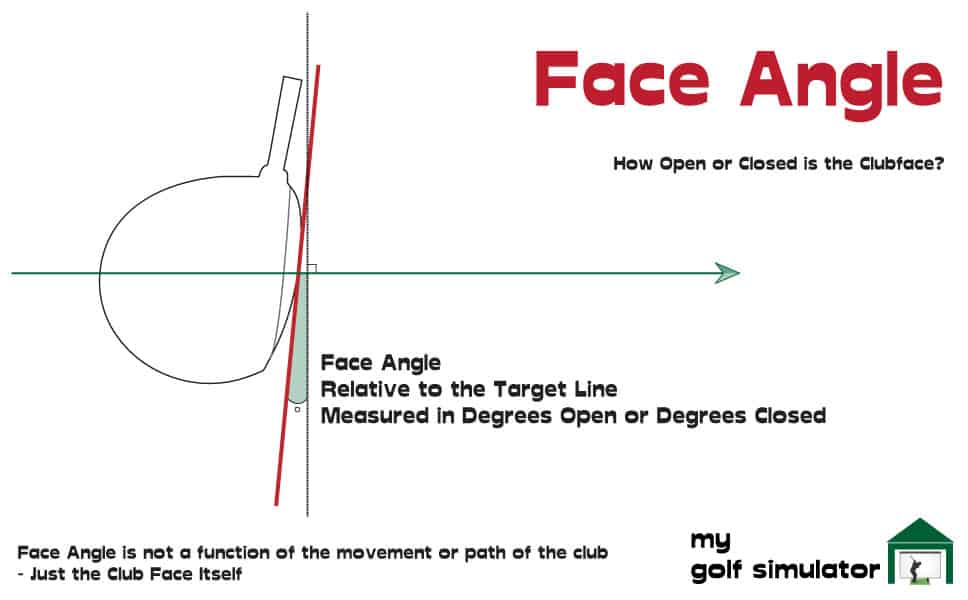
Where the face points at impact: open positive, closed negative (right-handed). The dominant influence on start direction — a square path with an open face starts straight and fades away.
Face to Path
Face angle minus club path: the shape-maker. Open-to-path fades, closed-to-path draws, square flies the path.
Dynamic Loft
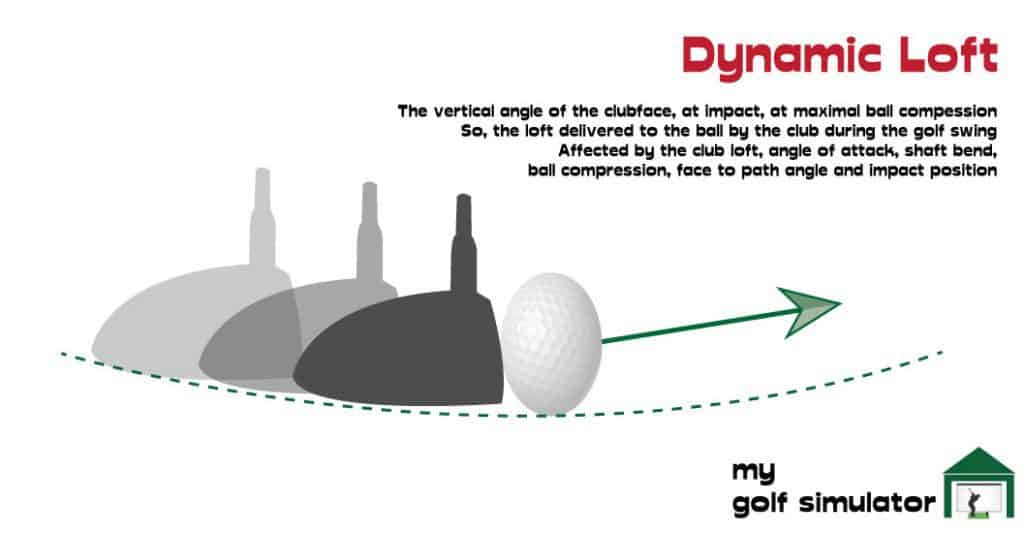
The loft actually delivered at maximum compression — distinct from the static loft stamped on the club. Moved by attack angle, shaft flex, ball compression, face-to-path and strike point; pair it with the right club speed and you’ve built maximum carry.
Spin Loft
The angle between dynamic loft and attack angle (strictly a 3D angle involving path and face too): bigger spin loft = more spin, less speed; smaller = the reverse — the reason wedges can’t match driver smash numbers. Usable both ways: high for stopping power, low for distance.

Impact Point
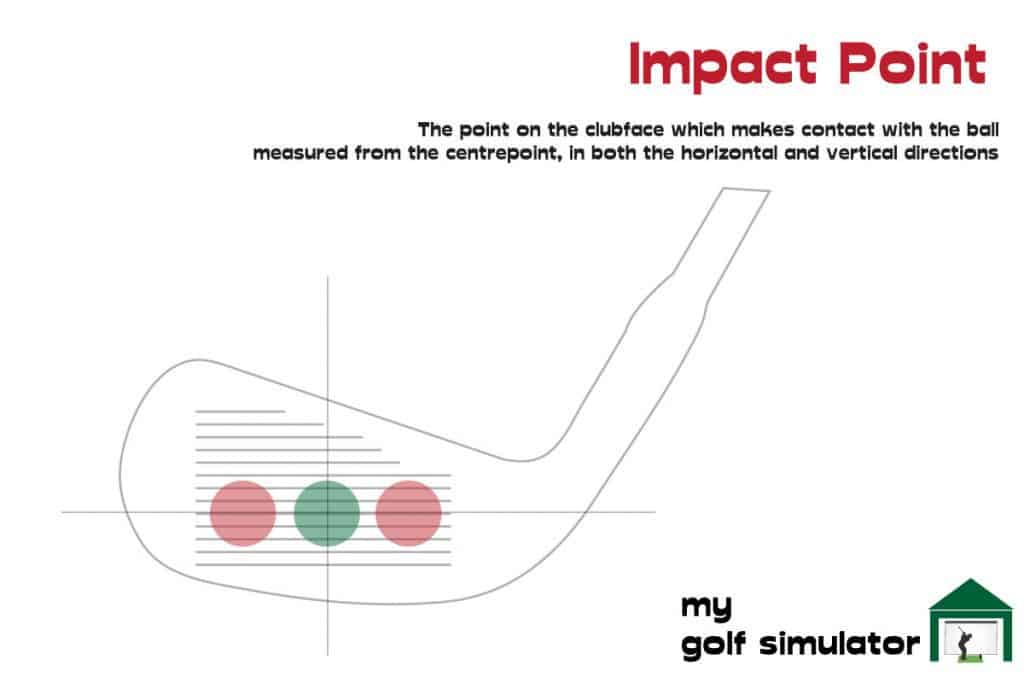
Where on the face the ball met the club, vertically and horizontally. Center = efficiency; the misses explain the gear effect stories below.
Lie Angle
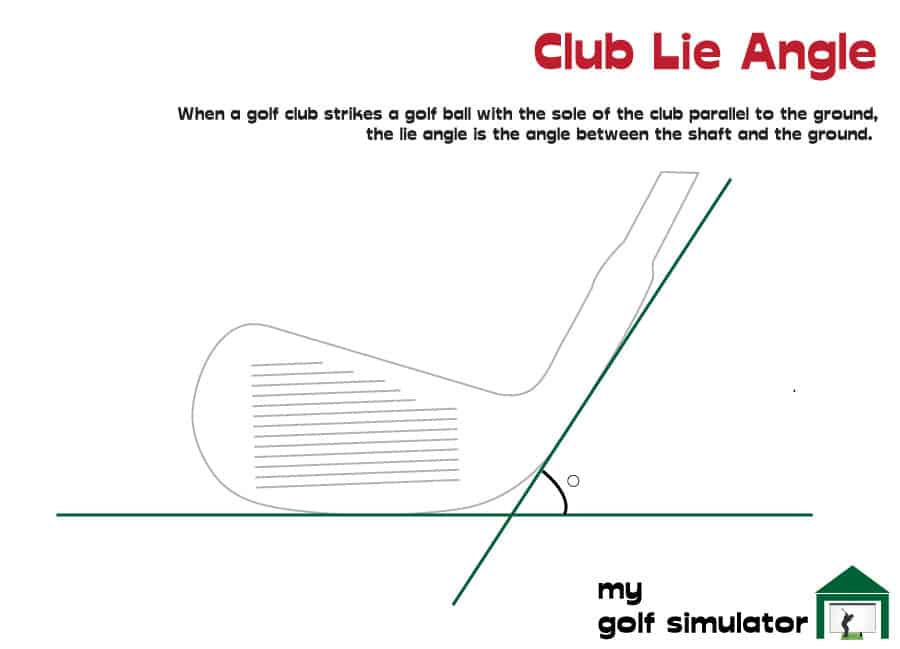
Shaft-to-ground angle at strike. Toe-deep divots say too flat (misses right); heel-deep say too upright (misses left). A fitting problem more than a swing problem — and it bites lofted clubs hardest.
Club Loft Angle
The static loft at rest, for comparison against dynamic loft.
Swing Plane
The angle between the ground and the swing’s arc: steeper with short clubs, flatter with long ones.
Low Point
Where the arc bottoms out. Before the ball: fat contact (or a teed driver hit on the up). After: ball-first compression.
Performance & setup
Distance to Pin
How far from the pin the ball stops; the classic practice-game score.
Shot Dispersion
How tightly a series of shots groups around the target line — consistency made visible. “This image is from the Mevo Plus, using the iPad. You can see the dispersion of shots on the right of the screen.”

Skills Scoring
Built-in coaching packages that grade shots for precision; scale varies by vendor.
Shot Type
Tee shot, approach, chip, pitch, flop or putt — the input that tells the software what to compare.
Which numbers to watch while you practice
The community’s practice threads converge on a live-versus-later split, corroborated across two large threads:
- Watch every shot: face angle / face-to-path, club path, carry, smash factor.
- Review after the session: spin axis, attack angle. One owner’s reasoning: “Spin axis and attack angle I save for after the session. Trying to process those in real time while also thinking about my swing thought is too much.”
- The clearest per-club breakdown, from one owner: “Wedges – launch angle, carry distance and spin rate. Irons – face to path, dynamic loft, carry distance and land angle. Driver – club path, face to path, attack angle, spin rate. All of them – smash factor, you need to know you are hitting it efficiently.”
The diagnostic reasoning is worth learning from a real case. One Garmin R50 owner posted an apparent contradiction — path reading in-to-out while the ball sliced. The thread converged on gear effect from a heel strike, and pointed at the evidence: smash factors of 1.15–1.34. “Until you hit the center of the face, everyting else is moot,” as one commenter put it. One dissenter pushed back on principle — smash factor is irrelevant if the measured values upstream are wrong — and that dissent is worth honoring: it’s the whole trust question in one sentence.
AI-assisted session review is emerging as a real pattern, imperfect and said so: two owners independently found CSV-upload summaries useful for spotting trends, and both flagged the limits — one noted the tools occasionally make things up; the other found them good at flagging what changed, bad at knowing why.
When the numbers look wrong
Three dated case studies from this summer, each with a different verdict:
- Blame the device (unanimously): a Golfzon bay read driver spin so high it cost ~70 yards versus real life; the owner sanity-checked at a Uneekor bay and confirmed it. The community’s read was blunt — venue-grade entertainment sims aren’t practice instruments.
- The device was right: a ProTee VX owner questioned a 3,400rpm driver reading; commenters did the math instead — ~6.7° of spin loft plus a low-face strike (evidenced by a 1.42 smash) produces exactly that. The number was telling him about his strike, not lying.
- Calibration drifts, even on Trackman: a 6-handicap saw spin and curvature on a newly-installed bay that never happened on course (“56° wedges that will rip backwards 30 feet”), and the experienced replies all pointed the same way — calibration. One player’s two bays disagreed by 180 yards on the same club three years in: “Chances are it’s just not been calibrated lately.”
- The italics tell: from the same thread, a tip most users don’t know, reported by one Trackman user (wording worth confirming on your own unit) — numbers shown in italics are estimated, not measured, and if spin or club speed is estimated, “your actual results could be quite different.”
- One genuinely open dispute: whether mats change spin versus grass — “A mat Will increase your spin by alot” against “A mat will almost always decrease spin rate compared to hitting off grass,” experienced users flatly contradicting each other. This article won’t pretend it’s settled.
The lesson, in order: check calibration, check strike quality, check measured-vs-estimated — and check your sim software’s own settings, because altitude, wind and distance-boost sliders can silently inflate a reading before the launch monitor’s number is even in question (3 owners, all burned by it).
Data tiers and money
Measured club data costs money, one way or another: GCQuad-class hardware, sticker workflows, or software gates (Uneekor Software Options – Comparison and Best Value Tips maps the tier-gated version). The sharpest live debate is the Bushnell Launch Pro’s subscription stack — $849 a year to run GSPro at 21 October 2026 list prices (Foresight+ Gold $599 plus GSPro $250; owners this summer put it at about $750) — and owners split honestly:
- One four-year owner sold his over it.
- Another kept his: “62 bucks a month which is less than 2 rounds with a cart.”
- A third named the trade plainly: real measured spin versus estimates is “night and day indoors” — and the catch is the stack.
At the budget radar tier (R10 / SC4 / MLM2 class), the informed single-voice guidance runs: trust the carry number, hold spin and club data loosely, let patterns over sessions tell the story. The same voice’s tier map: the Rapsodo MLM2Pro is the budget unit people point to for measured spin, while the R10’s spin runs estimated and “can get squirrely with shot shape in tight indoor spaces.” Real August street prices put all three around $330–350 — the data-quality ladder is much steeper than the price ladder down here.
And the Square Omni’s arc this summer — from contested pre-release buzz (“no first person account of someone holding an Omni beyond influencers”) to multiple independent owners endorsing it by late August (“zero regrets,” “actual integration with gspro”) — is a live example of the community verifying data claims fast; buyers report it can be hard to find at the moment. The cautionary mirror-image: a rival’s promised stickerless club data was reported walked back before the updated unit even shipped. Claimed capabilities are now community-audited within weeks — a genuinely new consumer protection.
Putting data note
Putting analyzers use a different parameter family than full-swing monitors. This article once promised: “I am planning a follow-up article detailing how to read the data parameters used putting analyzers. Keep an eye out” — a line signed off with a smiley — and the promise has since been partly delivered: Skytrak Putting – Problems, Tips & Ideas.
FAQ
Measured or calculated — how do I tell?
The manual’s data table outranks the spec sheet — spec sheets list everything displayed, not everything measured. On Trackman, one user’s tip says italics mean estimated (verify on your unit). Then ask the two questions one data-focused owner framed: does it measure it, and what do you have to buy to turn it on?
Why does my club path disagree with my ball flight?
Usually gear effect: an off-center strike twists spin against the path. Check impact point and smash factor before doubting either number.
Is smash factor the number to chase?
It’s the efficiency gauge — ~1.5 driver — but garbage upstream makes garbage smash; the dissent in the R50 case was right about that.
Do I need special balls?
Device-dependent: SkyTrak wants a clean white ball, logo toward the lens, for spin; Foresight reads any ball (markers go on the club); RCT balls enhance the KIT’s spin. Range and foam balls barely disturb club data but wreck ball data — a foam ball’s flight tells you little. “We cover this much more in our dedicated article here.” How do Launch Monitors Work? – Radar vs Camera Systems

What’s the most important number for improvement?
Carry dispersion over sessions. Patterns beat readings — owners at every device tier say some version of it, and the most serious ones built tools to aggregate their sessions rather than trust any single shot’s story.
My unit shows a metric its manual never mentions — is it fake?
On most setups, it’s modeled by your sim software rather than the device. The chain is device → software → screen, and each link can add derived numbers. The manual’s data table tells you what the hardware contributes; everything else arrived in software.
Summary
Ball data first, club data with provenance, carry as a model, patterns over readings. And when a number looks wrong, work the order — calibration, strike quality, measured-vs-estimated, your sim settings — before you blame your swing.
Bushnell Launch Pro vs SkyTrak ST MAX (2026)
Golf Simulator Packages vs Building Your Own: Which Is Better Value?
ABOUT THE AUTHOR
Hello! My name is Alex and it is my mission to bring you all the information you need to build your own home golf simulator! I hope mygolfsimulator.com helps you on your journey to better golf at home!
LEGAL INFORMATION
On this site, you'll find articles on all aspects of building a golf simulator. I will also link to other sites where you can buy some of the simulator components. Some of these links may be affiliate links, which means if you click them I gain a small commission at no extra cost to you. This really helps out me and my site so thank you in advance! mygolfsimulator.com and all related social media accounts are property of Awonline LTD.